
Growth charts and curves in children – what you need to know
I have mixed feelings when it comes to growth charts and curves.
On one hand, they can be a fundamental and valuable tool. When used wisely, they help detect early signs of a wide range of pediatric conditions.
On the other hand, I feel that growth charts have, in some cases, become the main focus of regular doctor visits or conversations among parents. As a result, instead of leaving the appointment with meaningful advice to support the child’s health and well-being, a parent might leave remembering something like, “The nurse said my child’s weight dropped from the 57th to the 43rd percentile.” But what does that really mean?
If that’s all the information provided, then it doesn’t mean much at all.
This post has two main goals:
1. To explain what growth charts are and what percentiles actually represent.
2. To give parents the tools to understand when a change in growth percentiles is significant—and when it’s not.
Growth charts and curves – what are they?
The formal definition is as follows:
Growth charts are graphs used by healthcare professionals and parents to monitor a child’s development during the early years. They are one of the most important tools for assessing a child’s overall health and nutritional status.
Growth charts track patterns in weight, height, body mass index (BMI), and head circumference in children and adolescents, based on age and sex, using percentiles. Each country typically has its own set of national growth charts. I recommend searching for your country’s growth charts online. You can find the CDC growth charts here, these apply to children worldwide.
What is the role of growth charts and percentiles?
The easiest way to answer this is with an example:
Bob Smith was born at term, at 39 weeks’ gestation, with a birth weight of 2,850 grams. At 3 months old, he weighs 4,450 grams. Is this normal? Do these numbers make sense? How do we decide?
One way is to recall that the expected rate of weight gain in the first three months of life is around 750 grams per month (look here for more frequently asked questions about infant feeding and nutrition). Based on that, we can estimate that this baby has not been gaining enough weight.
However, it’s not practical to remember specific growth expectations for every age, weight, height, head circumference, and gender. That’s exactly why growth charts and percentiles are used — they offer a standardized, visual way to track a child’s development and identify potential concerns.
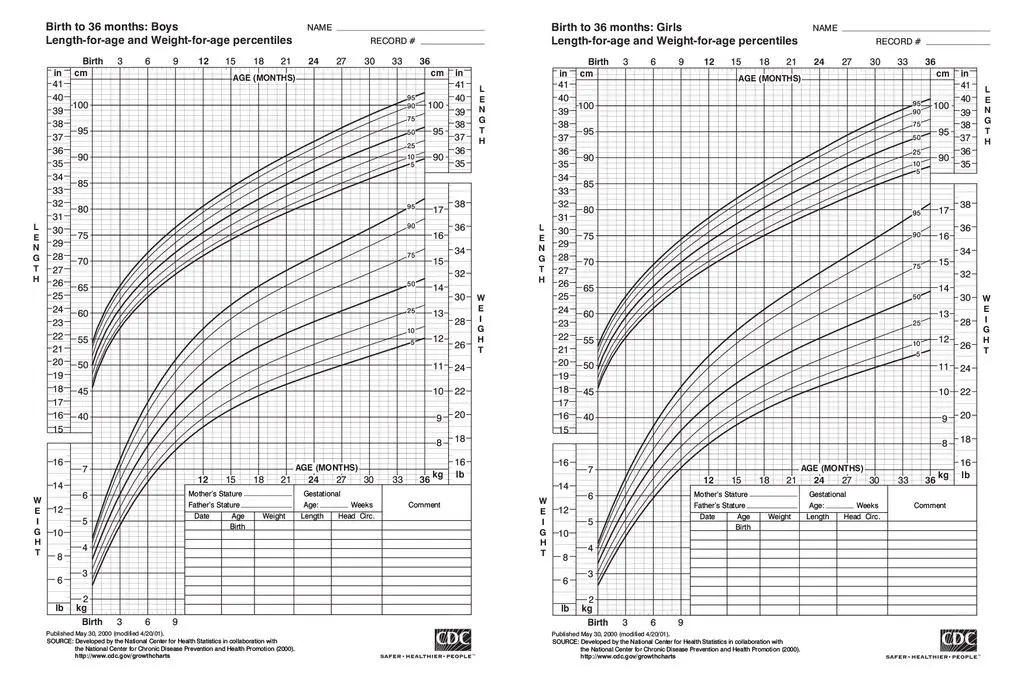
If we open the growth chart that shows weight-for-age percentiles in boys from birth to 24 months (link here) and plot Bob’s birth weight and current weight, we’ll see the following:
– At birth his weight was in the 10th percentile
– His current weight is under the 3rd percentile.
This shows that Bob’s weight gain has been insufficient—he dropped from around the 15th percentile at birth to under the 3rd percentile over 3 months.
Would I be equally concerned about a baby whose weight dropped from the 85th percentile to the 70th? Not necessarily, and that is my exact point. More about this below.
What do these percentiles even mean?
The 15th percentile means that 85% of children in the reference population weigh more than Bob Smith, and 15% weigh less. In most computerized systems, you can get the exact percentile by simply entering the child’s weight.
Similar percentile-based growth charts exist for length (height) and head circumference. Naturally, there are different charts depending on a child’s age and gender.
What about special populations? Today, it’s increasingly common to use specific growth charts tailored to certain groups, because it’s clear that a child born prematurely at 29 weeks will grow at a different rate than one born full term at 39 weeks. There are specialized charts for children born prematurely, those with chronic illnesses, children with Down syndrome, and others.
So before placing a child’s measurements on a standard growth chart, make sure the child doesn’t belong to a population that requires a specific chart. Comparing a child to the wrong standard can lead to unnecessary concern—or missed issues.
What is the problem with the using growth charts?
a. Not all babies follow the same growth curve. Children are individuals, and their growth patterns are influenced by many factors—genetics, nutrition, and environment, to name a few. One child’s parents might be basketball players, while another’s might be football players. One baby may be exclusively breastfed for a year, while another might consume 210 ml of formula every three hours. How can we expect all of these children to fit neatly into the same growth curve?
b. Growth is dynamic. Focusing too heavily on percentiles while ignoring other important aspects of a child’s health is a flawed approach. A child in the 5th percentile might be perfectly healthy and growing according to their genetic potential—or they could have an underlying medical issue that requires attention. A single percentile doesn’t tell the whole story. It’s the pattern over time and the clinical context that truly matter.
Placing too much emphasis on percentile data can also cause unnecessary parental anxiety and lead to excessive or inappropriate medical investigations.
Therefore, in my opinion, considering both the advantages and limitations, growth charts and curves should be seen as an additional tool that healthcare professionals can use to assess a child’s health status. When used thoughtfully and in context, they can offer valuable insight into a child’s growth and overall well-being.
What do I emphasis when it comes to growth charts and percentiles?
a. Clinical context matters most. A good health professional knows how to distinguish between a healthy and an unhealthy child using clinical judgment and the full picture of the child’s health—not just numbers on a chart. In a well-nourished, thriving child, percentiles are often less significant. However, in a child with health concerns, more attention should be paid to growth patterns and percentile changes. Most pediatricians are familiar with normal growth rates for weight and head circumference and can often detect abnormalities quickly, even without consulting growth charts.
b. Watch for significant percentile shift. One key indicator to pay attention to is a change of more than two percentile lines between visits. While computerized systems today provide exact percentile values, traditional paper charts help visualize shifts more clearly. A drop or rise crossing more than two major percentile lines should prompt further evaluation. That said, in most cases, such changes are not cause for concern—but they do warrant thoughtful consideration.
c. Be aware of children whose data lie on the extremes of the charts. Being in the middle of the growth chart is often an advantage, as it suggests the child is growing at a typical rate. A child whose weight percentile drops from the 60th to the 40th is usually less concerning than one whose weight drops from the 20th percentile to the 3rd. Extreme percentile shifts, especially toward the lower end, may signal the need for further investigation.
d. Monitor changes over time. Growth measurements, such as head circumference, can vary slightly from one physician to another. If you ask three different doctors to measure the head circumference of the same child at the same time, you may get three slightly different results—each falling on a different percentile. However, a drop in head circumference percentile from the 40th to the 30th over two months, in an otherwise healthy baby, might not indicate a serious issue. Still, it’s essential to follow up, and I would typically advise parents to return in a month for reassessment. In cases like this, I’d also make a note to myself to carefully monitor the child’s development and consider performing a head ultrasound during the next visit if concerns persist.
To summarize, try not to make the growth chart the primary focus of the visit, but also be mindful of any growth trends that align with your child’s overall health and development.
When in doubt, consult a pediatrician. Trust them to determine whether further monitoring or evaluation is needed. After all, pediatrics is as much an art as it is a science.
For comments and questions, please register